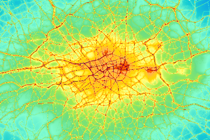
It has been widely reported that Oxford Street in London has the highest concentrations of nitrogen dioxide (NO2) in the World following an article by Jonathan Leake (Environment Editor of the Sunday Times, 6th July 2014). This article was based on a presentation at the 21st Anniversary meeting of the Environmental Research Group at King’s College London. The original presentation is available here LAQN website given by David Carslaw. In that presentation David Carslaw raised the possibility that measurements of NO2 concentration recorded at the Oxford Street roadside air pollution monitoring site were to his knowledge the highest in the world.
Can this be true? It seems unbelievable that ‘modern’ London could experience the highest concentrations of a key pollutant. So what is the background to this conclusion?
Air pollution measurements are made continuously in Oxford Street by Westminster Council as part of the London Air Quality Network. In 2013 (the most recent full year for which statistics are available) the annual mean NO2 was 135 µg m-3 and there were 1502 hours greater than 200 µg m-3. The EU sets limits for NO2 based on World Health Organisation Guidelines. These state that the annual mean must not be more than 40 µg m-3 and NO2 should not be above 200 µg m-3 for more than 18 hours per year. The health impacts of NO2 are also of increasing concern as shown by the World Health Organisation (WHO), which recently reviewed the health aspects of air pollution, including NO2.
The annual mean NO2 concentration at Oxford Street is easily the highest in Europe. This can be confirmed by checking the European Environment Agency (EEA) Airbase database that compiles air quality data from across Europe. In 2012 (the most recent year for which data are available) the highest annual mean NO2 concentration was 94 µg m-3 out of 2,788 sites which operate for at least three quarters of the year. In a recent report considering sites in Asia in 2008 the highest NO2 annual mean 77 µg m-3 out of 234 measurement locations. In India, a recent summary of concentrations in major cities such as Delhi and Mumbai shows annual mean NO2 up to 90 µg m-3 in 2001 and about 62 µg m-3 in 2010. Clearly there are questions about how representative sites are in different cities, their number and so on, but as described below there are reasons to believe many roads in central London will tend to have the highest NO2 concentrations of anywhere.
It is worth noting that there are sites around the world that have higher individual hours where the concentration is higher than Oxford Street - and this includes sites in London in the past (such as sites in London during the December 1991 episode).
Most NO2 in the atmosphere comes from the oxidation of nitric oxide (NO) to NO2 by ozone. Historically petrol and diesel vehicle emissions of NOx (the sum of NO and NO2) have been dominated by emissions of NO (with NO2 being less than 10% of the total NOx). However, over the past 10 years or so there has been an important change in diesel vehicle emission technology that has led to substantial increases in emitted NO2. The reason is the increased use of diesel oxidation catalysts and particle filters. To burn off the black soot from diesel vehicle exhaust requires temperatures in excess of 500oC, which is a much higher temperature than the exhaust gases reach. However, NO2 is a very powerful oxidant and it can be used to help burn off these sooty particles at much lower temperatures (around 200 oC). These emission control systems therefore deliberately produce increased emissions of NO2 to help burn off the sooty particles - and they are very effective in doing so. High numbers of vehicles with this type of emissions control technology is at the heart of the high ambient NO2 concentrations seen in London and across many sites in Europe.
Returning to Oxford Street, there are several reasons why it has such high concentrations of NO2:
- The street is embedded in the centre of a very large source of NOx i.e. London
- It is completely dominated by diesel vehicles (buses/taxis) and has among the highest flow of buses of anywhere in the UK.
- A large fraction of the bus fleet uses technology based on CRTs (Continuously Regenerating Trap) and similar technologies that deliberately produce increased emissions of NO2, as described above.
- It is a street canyon whose orientation also serves to maximise concentrations. Street canyon locations are not as well-ventilated as open locations and this tends to result in increased concentrations.
Point number 3 above is the most important. The fact that this technology is very effective at reducing fine particulate emissions is important but so too is the generation of increased emissions of directly emitted NO2.
David Carslaw, 9th July 2014
Note: European Airbase measurements can also be accessed through the open-source R package called openair.
Item date 10/07/2014 14:00:00
Follow Us
Our newsletter
 Privacy Notice Summary:
- Who this is for: You must be at least 13 years old to use this service.
- What we collect: We store your email address
- Who we share it with: We use "Campaign Monitor" to store it, and do not share it with anyone else.
- More Info: You can see our full privacy notice here
AirMail newsletter
The latest news and research from ERG: View the archive

